QC statistics for lane 7
| Date |
Flowcell |
Lane |
Platform Unit |
Readgroup |
Sample |
Library |
Type |
Project |
Genome |
Centre |
|
B04DHABXX |
7 |
110302_SN553_0085_BB04DHABXX_7 |
WTCHG_11897 |
samples |
4626/10 |
gDNA PE |
P100244 |
Mouse37 |
WTCHG |
| Lane |
Length |
Tiles |
Clusters PF |
% PF |
Yield (Mrd) |
Yield (Mb) |
Yield (Mb Q20) |
% Mapped |
% Coverage⊥ |
% Primer |
% Variants |
Mean cov.* |
% high cov.ℵ |
% dups |
% pair dups |
Link |
| 7.1 |
101 |
32 |
2574731 |
87.2 |
71.83 |
7254.48 |
6145.45 |
98.2 |
81.6 |
0.00 |
1.03 ± 0.00 |
3.20 |
13.04 |
7.27 |
6.50 |
back |
| 7.2 |
101 |
32 |
2574731 |
87.2 |
71.83 |
7254.48 |
6720.78 |
98.1 |
81.6 |
0.00 |
0.95 ± 0.00 |
3.20 |
13.04 |
7.28 |
6.52 |
|
⊥ Fraction of reference that is covered at least once * Mean coverage is computed over regions that are covered at least once ℵ Proportion of reads in regions with coverage in top 0.1 percentile
Lane QC statistics and plots
| Lane |
% GC |
% GCmapped |
σpos(%GC) |
insert ± MAD |
% exonic |
% exon cov'ge |
%N |
maxpos %N |
%lowQ |
%lowQend |
avgQ |
| 7.1 |
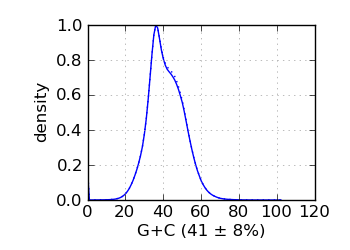
41.2 ± 8.4 |
41.2 ± 8.4 |
0.50 |
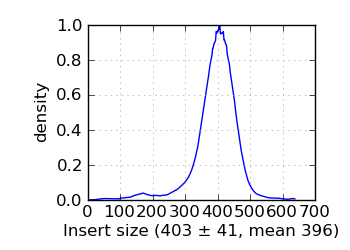
403 ± 41 |
1.2 |
88.5 |
0.0 |
0.1 |
12.7 |
54.5 |
27.4 |
| 7.2 |
40.3 ± 9.5 |
40.9 ± 8.2 |
0.35 |
403 ± 41 |
1.2 |
88.7 |
0.1 |
0.1 |
5.6 |
27.3 |
30.4 |
G+C histogram∋
 |
Insert size histogram∞
 |
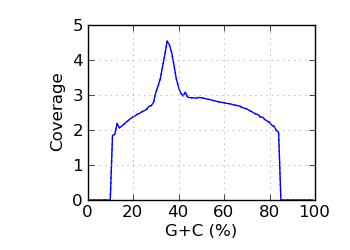
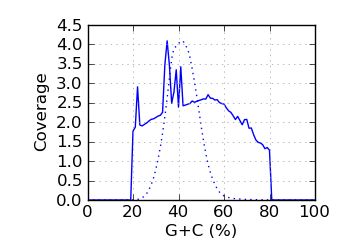
Mapped coverage by G+C℘
 |
|
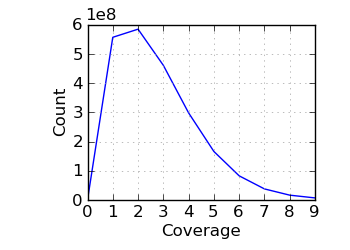
Coverage histogram
 |
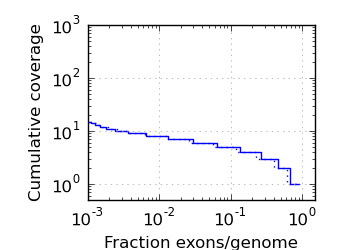
Exon/genome coverage distribution
 |
Genomic coverage by G+C∅
 |
|
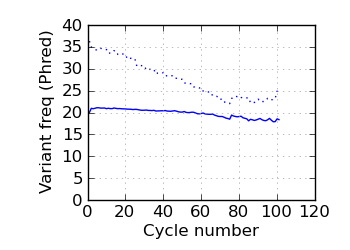
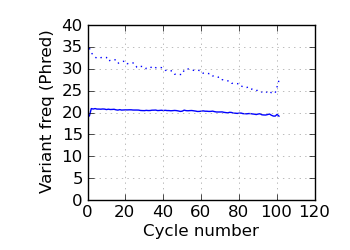
(Predicted) variants by cycle∇ (read 1)
 |
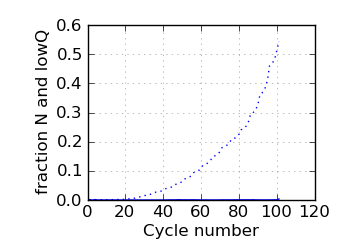
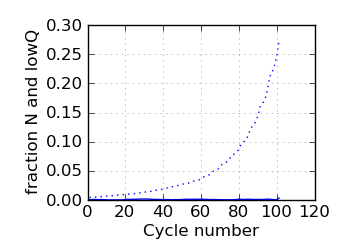
Fraction N/lowQ∋, read 1
 |
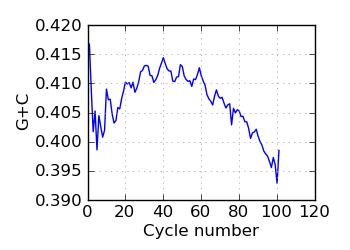
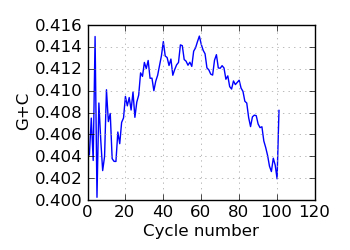
G+C by cycle (PF)∋, read 1
 |
|
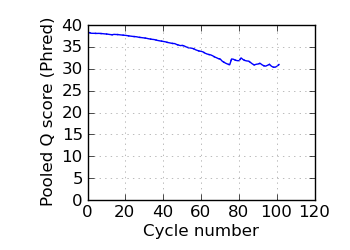
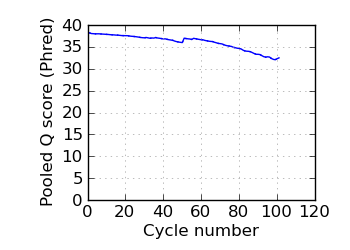
Mean Q by cycle∇, read 1
 |
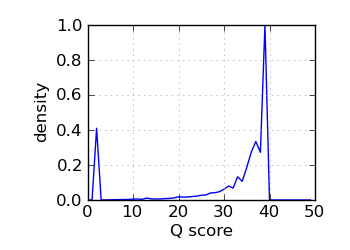
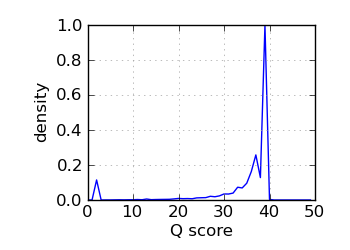
Q score histogram, read 1
 |
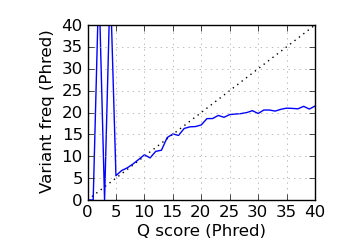
Variants by Q, read 1
 |
|
(Predicted) variants by cycle∇ (read 2)
 |
Fraction N/lowQ∋, read 2
 |
G+C by cycle (PF)∋, read 2
 |
|
Mean Q by cycle∇, read 2
 |
Q score histogram, read 2
 |
Variants by Q, read 2
 |
|
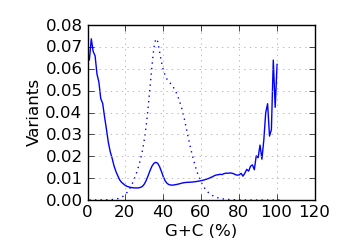
Variants by GC
 |
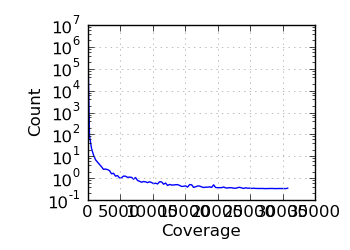
Log coverage histogram
 |
Legend
 |
∋ The Fraction N/Low Q plots, and dotted lines on the GC histogram plots, refer to all reads that have
passed chastity filters. If a reference genome was available, all others refer to mapped reads, otherwise
they too refer to chastity-filtered reads. The dotted lines in the fraction N/lowQ plot correspond to the
fraction of bases with quality score 4 or less. ∇ "Predicted variants" (dashed line) is the expected error frequency expressed as a Phred score,
and may be compared with the "Variants by cycle" graph (solid line). "Mean Q" (solid) is the numerical
mean Q score and is a measure of the average information content per read. These graphs use mapped reads only;
the dashed line in the Mean Q plot uses all (PF) reads. All four graphs are calculated on called bases with
Q Phred score above 4 only. ℘ Mapped coverage by G+C. The coverage was averaged over those genomic regions that were covered at least once.
Regions with coverage in the top 0.1 percentile were excluded; the dotted line shows results for all reads.
The G+C fraction was computed from read bases, excluding Ns and bases with quality below 4. ∅ Genomic coverage by G+C. The G+C fraction was computed from the reference genome, over the approximate fragment
Regions with coverage in the top 0.1 percentile were excluded.
The G+C histogram is shown as a dotted line (arbitrary Y scale). ∞ The insert size distribution is summarized by the median and median absolute deviation.
Multiplex QC statistics
| Lane |
Mx |
Yield Mrd |
Yield Mb Q20 |
% mapped |
% variants |
% exonic |
% exon coverage |
% pair dups |
% GC |
% GCmapped |
σpos(%GC) |
insert ± MAD |
%lowQ |
avg Q |
| 7.1 |
All |
71.83 |
6145.45 |
98.2 |
0.90 |
1.2 |
88.5 |
6.50 |
41.2 ± 8.4 |
41.2 ± 8.4 |
0.50 |
403 ± 41 |
12.7 |
27.4 |
| 7.2 |
All |
71.83 |
6720.78 |
98.1 |
0.90 |
1.2 |
88.7 |
6.52 |
40.3 ± 9.5 |
40.9 ± 8.2 |
0.35 |
403 ± 41 |
5.6 |
30.4 |
Yield (Mrd)
 |
Median insert size
 |
MAD insert size
 |
|
Mean G+C
 |
Std. dev. G+C by reads
 |
Std. dev. G+C by position
 |
Tile QC statistics and plots
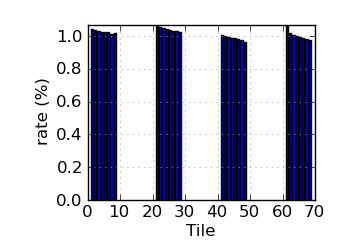
Variant rate by tile∝ (read 1)
 |
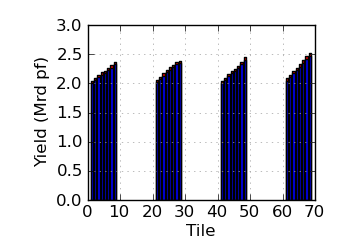
Raw/mapped yield by tile (read 1)
 |
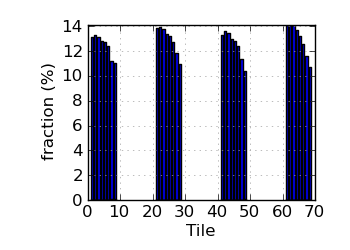
Fraction N/lowQ by tile (read 1)
 |
|
Variant rate by tile∝ (read 2)
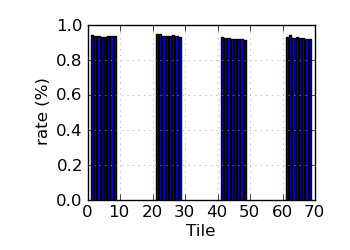 |
Raw/mapped yield by tile (read 2)
 |
Fraction N/lowQ by tile (read 2)
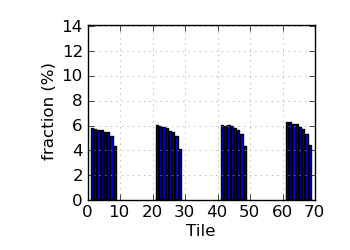 |
∝ HiSeq tiles are grouped in order: swathe 1 top; swathe 1 bottom; swathe 2 top; etc.
| Lane |
Tile |
Yield (pf, Mrd) |
Error rate (%) |
Mapped (%) |
Average Q |
N bases (%) |
LowQ (%) |
Last base lowQ (%) |
| 7.1 |
1 |
2.040 |
1.04 |
98.29 |
35.17 |
0.03 |
13.10 |
53.86 |
| 7.1 |
2 |
2.086 |
1.04 |
98.28 |
35.19 |
0.03 |
13.27 |
55.46 |
| 7.1 |
3 |
2.140 |
1.03 |
98.27 |
35.17 |
0.03 |
13.14 |
55.24 |
| 7.1 |
4 |
2.188 |
1.03 |
98.26 |
35.16 |
0.04 |
12.83 |
54.14 |
| 7.1 |
5 |
2.217 |
1.02 |
98.24 |
35.15 |
0.04 |
12.69 |
53.96 |
| 7.1 |
6 |
2.260 |
1.02 |
98.22 |
35.08 |
0.04 |
12.40 |
52.92 |
| 7.1 |
7 |
2.312 |
1.01 |
98.22 |
35.06 |
0.04 |
11.18 |
51.30 |
| 7.1 |
8 |
2.366 |
1.02 |
98.21 |
34.62 |
0.05 |
11.06 |
57.79 |
| 7.1 |
21 |
2.063 |
1.07 |
98.30 |
35.06 |
0.02 |
13.84 |
56.53 |
| 7.1 |
22 |
2.113 |
1.06 |
98.27 |
35.09 |
0.03 |
13.92 |
57.89 |
| 7.1 |
23 |
2.171 |
1.05 |
98.26 |
35.08 |
0.03 |
13.75 |
57.56 |
| 7.1 |
24 |
2.232 |
1.04 |
98.25 |
35.07 |
0.03 |
13.41 |
56.37 |
| 7.1 |
25 |
2.273 |
1.04 |
98.23 |
35.04 |
0.03 |
13.24 |
55.54 |
| 7.1 |
26 |
2.318 |
1.03 |
98.23 |
35.03 |
0.03 |
12.70 |
53.90 |
| 7.1 |
27 |
2.367 |
1.03 |
98.20 |
34.95 |
0.03 |
11.81 |
53.30 |
| 7.1 |
28 |
2.387 |
1.02 |
98.18 |
34.62 |
0.04 |
10.93 |
57.27 |
| 7.1 |
41 |
2.044 |
1.01 |
98.29 |
35.21 |
0.03 |
13.30 |
53.65 |
| 7.1 |
42 |
2.097 |
1.00 |
98.28 |
35.20 |
0.03 |
13.58 |
54.85 |
| 7.1 |
43 |
2.161 |
1.00 |
98.26 |
35.19 |
0.03 |
13.47 |
55.02 |
| 7.1 |
44 |
2.212 |
0.99 |
98.26 |
35.19 |
0.04 |
12.96 |
53.24 |
| 7.1 |
45 |
2.254 |
0.99 |
98.25 |
35.16 |
0.04 |
12.84 |
52.56 |
| 7.1 |
46 |
2.304 |
0.98 |
98.23 |
35.14 |
0.04 |
12.44 |
51.78 |
| 7.1 |
47 |
2.373 |
0.97 |
98.22 |
35.10 |
0.04 |
11.39 |
50.29 |
| 7.1 |
48 |
2.444 |
0.97 |
98.19 |
34.76 |
0.04 |
10.36 |
54.12 |
| 7.1 |
61 |
2.084 |
1.07 |
98.28 |
35.10 |
0.02 |
14.09 |
55.28 |
| 7.1 |
62 |
2.143 |
1.02 |
98.26 |
35.12 |
0.02 |
14.10 |
56.90 |
| 7.1 |
63 |
2.207 |
1.01 |
98.26 |
35.11 |
0.02 |
14.06 |
56.90 |
| 7.1 |
64 |
2.267 |
1.00 |
98.23 |
35.08 |
0.03 |
13.67 |
55.38 |
| 7.1 |
65 |
2.329 |
0.99 |
98.24 |
35.10 |
0.03 |
13.17 |
53.59 |
| 7.1 |
66 |
2.393 |
0.99 |
98.21 |
35.12 |
0.03 |
12.53 |
52.08 |
| 7.1 |
67 |
2.462 |
0.98 |
98.21 |
35.03 |
0.03 |
11.60 |
50.57 |
| 7.1 |
68 |
2.519 |
0.98 |
98.21 |
34.69 |
0.04 |
10.73 |
55.02 |
|
| Lane |
Tile |
Yield (pf, Mrd) |
Error rate (%) |
Mapped (%) |
Average Q |
N bases (%) |
LowQ (%) |
Last base lowQ (%) |
| 7.2 |
1 |
2.040 |
0.94 |
98.16 |
36.05 |
0.07 |
5.78 |
29.64 |
| 7.2 |
2 |
2.086 |
0.94 |
98.14 |
36.10 |
0.07 |
5.76 |
29.68 |
| 7.2 |
3 |
2.140 |
0.94 |
98.12 |
36.15 |
0.08 |
5.66 |
29.01 |
| 7.2 |
4 |
2.188 |
0.93 |
98.08 |
36.15 |
0.09 |
5.67 |
27.99 |
| 7.2 |
5 |
2.217 |
0.93 |
98.08 |
36.18 |
0.10 |
5.50 |
27.27 |
| 7.2 |
6 |
2.260 |
0.94 |
98.06 |
36.16 |
0.09 |
5.46 |
27.36 |
| 7.2 |
7 |
2.312 |
0.93 |
98.05 |
36.19 |
0.10 |
5.12 |
25.51 |
| 7.2 |
8 |
2.366 |
0.94 |
98.04 |
36.25 |
0.10 |
4.32 |
21.27 |
| 7.2 |
21 |
2.063 |
0.95 |
98.12 |
35.93 |
0.07 |
6.03 |
30.43 |
| 7.2 |
22 |
2.113 |
0.95 |
98.11 |
35.99 |
0.08 |
5.92 |
30.62 |
| 7.2 |
23 |
2.171 |
0.94 |
98.10 |
36.05 |
0.07 |
5.88 |
29.86 |
| 7.2 |
24 |
2.232 |
0.94 |
98.07 |
36.08 |
0.08 |
5.80 |
28.57 |
| 7.2 |
25 |
2.273 |
0.94 |
98.06 |
36.11 |
0.08 |
5.58 |
27.56 |
| 7.2 |
26 |
2.318 |
0.94 |
98.07 |
36.13 |
0.08 |
5.46 |
27.05 |
| 7.2 |
27 |
2.367 |
0.94 |
98.05 |
36.14 |
0.08 |
5.14 |
25.13 |
| 7.2 |
28 |
2.387 |
0.93 |
98.03 |
36.29 |
0.09 |
4.12 |
20.40 |
| 7.2 |
41 |
2.044 |
0.93 |
98.10 |
36.11 |
0.08 |
6.02 |
29.81 |
| 7.2 |
42 |
2.097 |
0.93 |
98.12 |
36.14 |
0.08 |
5.98 |
30.12 |
| 7.2 |
43 |
2.161 |
0.92 |
98.07 |
36.17 |
0.09 |
6.04 |
29.86 |
| 7.2 |
44 |
2.212 |
0.92 |
98.05 |
36.19 |
0.09 |
5.95 |
28.50 |
| 7.2 |
45 |
2.254 |
0.92 |
98.07 |
36.23 |
0.10 |
5.76 |
27.72 |
| 7.2 |
46 |
2.304 |
0.92 |
98.04 |
36.24 |
0.10 |
5.65 |
27.07 |
| 7.2 |
47 |
2.373 |
0.92 |
98.03 |
36.30 |
0.09 |
5.28 |
24.92 |
| 7.2 |
48 |
2.444 |
0.91 |
98.02 |
36.45 |
0.10 |
4.38 |
20.45 |
| 7.2 |
61 |
2.084 |
0.93 |
98.07 |
36.02 |
0.09 |
6.26 |
30.89 |
| 7.2 |
62 |
2.143 |
0.94 |
98.08 |
36.05 |
0.10 |
6.25 |
31.35 |
| 7.2 |
63 |
2.207 |
0.93 |
98.07 |
36.11 |
0.09 |
6.09 |
30.21 |
| 7.2 |
64 |
2.267 |
0.93 |
98.02 |
36.11 |
0.10 |
6.10 |
29.11 |
| 7.2 |
65 |
2.329 |
0.92 |
98.02 |
36.17 |
0.10 |
5.87 |
28.19 |
| 7.2 |
66 |
2.393 |
0.92 |
98.00 |
36.18 |
0.10 |
5.73 |
27.08 |
| 7.2 |
67 |
2.462 |
0.92 |
98.01 |
36.23 |
0.10 |
5.34 |
24.96 |
| 7.2 |
68 |
2.519 |
0.92 |
97.99 |
36.34 |
0.11 |
4.45 |
20.30 |
|
QC version: 2.1