Flowcell QC summary (lanes 1,2,3,4)
| Date |
Flowcell |
Lane |
Platform Unit |
Readgroup |
Sample |
Library |
Type |
Project |
Genome |
Centre |
|
B04D1ABXX |
1 |
110311_SN228_0126_BB04D1ABXX_1 |
WTCHG_13405 |
samples |
4619/10 |
gDNA PE |
P100244 |
Mouse37 |
WTCHG |
|
B04D1ABXX |
2 |
110311_SN228_0126_BB04D1ABXX_2 |
WTCHG_13406 |
samples |
4620/10 |
gDNA PE |
P100244 |
Mouse37 |
WTCHG |
|
B04D1ABXX |
3 |
110311_SN228_0126_BB04D1ABXX_3 |
WTCHG_13407 |
samples |
4623/10 |
gDNA PE |
P100244 |
Mouse37 |
WTCHG |
|
B04D1ABXX |
4 |
110311_SN228_0126_BB04D1ABXX_4 |
WTCHG_13408 |
samples |
4624/10 |
gDNA PE |
P100244 |
Mouse37 |
WTCHG |
| Lane |
Length |
Tiles |
Clusters PF |
% PF |
Yield (Mrd) |
Yield (Mb) |
Yield (Mb Q20) |
% Mapped |
% Coverage⊥ |
% Primer |
% Variants |
Mean cov.* |
% high cov.ℵ |
% dups |
% pair dups |
Link |
| 1.1 |
101 |
32 |
3182781 |
95.6 |
97.37 |
9834.80 |
9428.55 |
98.4 |
84.7 |
0.00 |
0.93 ± 0.24 |
4.19 |
14.33 |
2.00 |
0.68 |
lane |
| 1.2 |
101 |
32 |
3182781 |
95.6 |
97.37 |
9834.80 |
9193.70 |
98.0 |
84.7 |
0.00 |
1.00 ± 0.24 |
4.18 |
14.32 |
2.00 |
0.69 |
|
| 2.1 |
101 |
32 |
2964184 |
95.8 |
90.83 |
9174.14 |
8821.11 |
98.4 |
87.0 |
0.00 |
0.93 ± 0.00 |
3.81 |
14.35 |
1.57 |
0.50 |
lane |
| 2.2 |
101 |
32 |
2964184 |
95.8 |
90.83 |
9174.14 |
8583.59 |
98.1 |
87.0 |
0.00 |
0.98 ± 0.00 |
3.80 |
14.34 |
1.56 |
0.49 |
|
| 3.1 |
101 |
32 |
3380301 |
94.9 |
102.64 |
10366.82 |
9935.00 |
98.5 |
88.4 |
0.00 |
0.94 ± 0.00 |
4.24 |
15.11 |
1.57 |
0.47 |
lane |
| 3.2 |
101 |
32 |
3380301 |
94.9 |
102.64 |
10366.82 |
9651.66 |
98.3 |
88.4 |
0.00 |
0.99 ± 0.00 |
4.23 |
15.10 |
1.56 |
0.47 |
|
| 4.1 |
101 |
32 |
3326660 |
95.0 |
101.17 |
10218.49 |
9803.45 |
98.5 |
88.2 |
0.00 |
0.93 ± 0.24 |
4.19 |
14.46 |
1.67 |
0.53 |
lane |
| 4.2 |
101 |
32 |
3326660 |
95.0 |
101.17 |
10218.49 |
9559.25 |
98.3 |
88.2 |
0.00 |
0.99 ± 0.33 |
4.17 |
14.48 |
1.66 |
0.53 |
|
⊥ Fraction of reference that is covered at least once * Mean coverage is computed over regions that are covered at least once ℵ Proportion of reads in regions with coverage in top 0.1 percentile
Lane QC statistics and plots
| Lane |
% GC |
% GCmapped |
σpos(%GC) |
insert ± MAD |
% exonic |
% exon cov'ge |
%N |
maxpos %N |
%lowQ |
%lowQend |
avgQ |
| 1.1 |
42.0 ± 7.9 |
42.0 ± 8.0 |
0.39 |
362 ± 53 |
1.4 |
94.2 |
0.1 |
0.1 |
3.0 |
15.2 |
32.4 |
| 1.2 |
41.0 ± 9.8 |
41.2 ± 9.5 |
0.36 |
362 ± 53 |
1.4 |
94.1 |
0.1 |
0.4 |
5.0 |
21.3 |
30.7 |
| 2.1 |
41.4 ± 8.1 |
41.3 ± 8.1 |
0.34 |
402 ± 53 |
1.3 |
94.0 |
0.0 |
0.2 |
2.8 |
14.7 |
32.6 |
| 2.2 |
40.6 ± 9.8 |
40.6 ± 9.6 |
0.32 |
402 ± 53 |
1.3 |
94.1 |
0.1 |
0.6 |
5.0 |
21.9 |
30.7 |
| 3.1 |
40.8 ± 7.9 |
40.8 ± 7.9 |
0.38 |
379 ± 43 |
1.1 |
93.3 |
0.1 |
0.2 |
3.0 |
15.4 |
32.5 |
| 3.2 |
39.6 ± 9.8 |
39.7 ± 9.5 |
0.34 |
379 ± 43 |
1.1 |
93.2 |
0.1 |
0.7 |
5.3 |
22.2 |
30.5 |
| 4.1 |
41.0 ± 7.9 |
41.0 ± 7.9 |
0.34 |
356 ± 39 |
1.1 |
93.7 |
0.1 |
0.2 |
2.9 |
14.8 |
32.5 |
| 4.2 |
39.9 ± 9.6 |
40.0 ± 9.4 |
0.32 |
356 ± 39 |
1.1 |
93.4 |
0.1 |
0.7 |
4.9 |
20.8 |
30.7 |
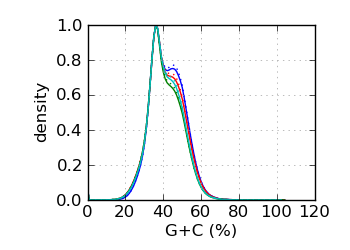
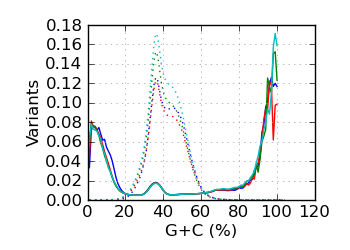
G+C histogram∋
 |
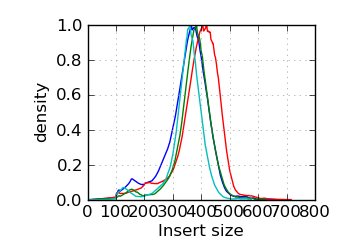
Insert size histogram∞
 |
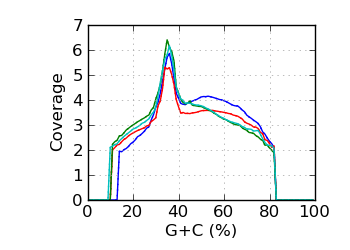
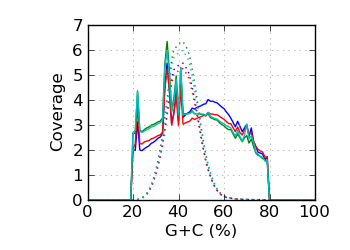
Mapped coverage by G+C℘
 |
|
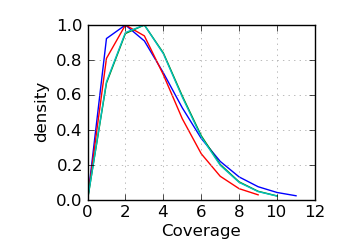
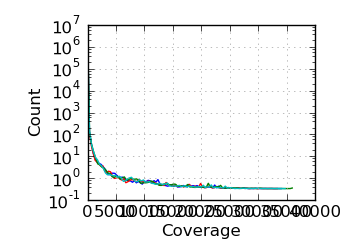
Coverage histogram
 |
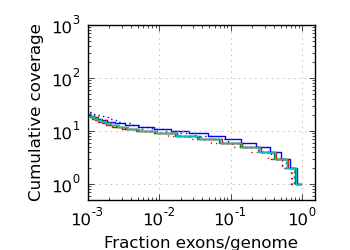
Exon/genome coverage distribution
 |
Genomic coverage by G+C∅
 |
|
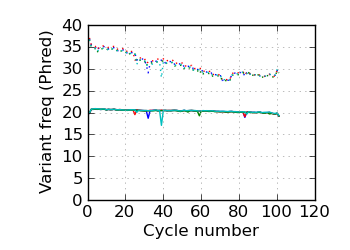
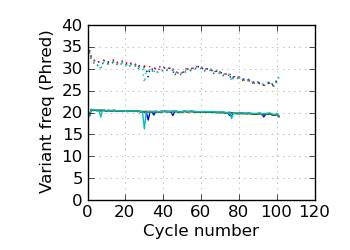
(Predicted) variants by cycle∇ (read 1)
 |
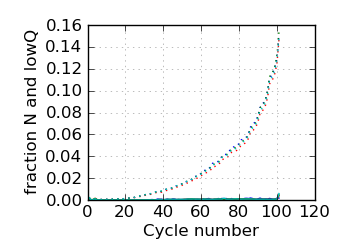
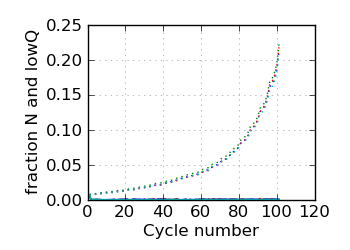
Fraction N/lowQ∋, read 1
 |
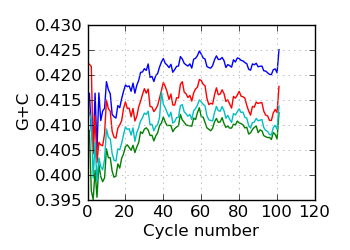
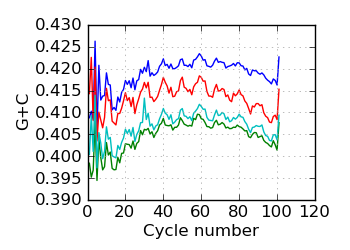
G+C by cycle (PF)∋, read 1
 |
|
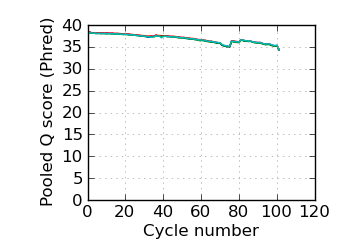
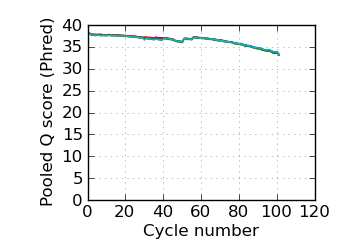
Mean Q by cycle∇, read 1
 |
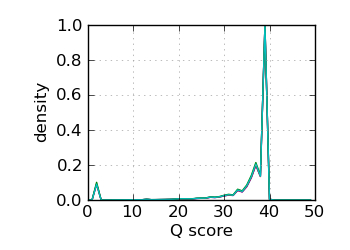
Q score histogram, read 1
 |
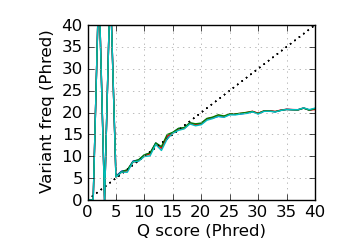
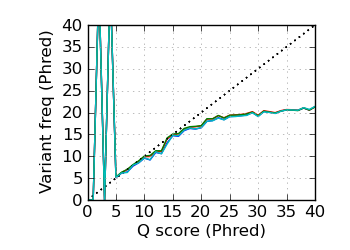
Variants by Q, read 1
 |
|
(Predicted) variants by cycle∇ (read 2)
 |
Fraction N/lowQ∋, read 2
 |
G+C by cycle (PF)∋, read 2
 |
|
Mean Q by cycle∇, read 2
 |
Q score histogram, read 2
 |
Variants by Q, read 2
 |
|
Variants by GC
 |
Log coverage histogram
 |
Legend
 |
∋ The Fraction N/Low Q plots, and dotted lines on the GC histogram plots, refer to all reads that have
passed chastity filters. If a reference genome was available, all others refer to mapped reads, otherwise
they too refer to chastity-filtered reads. The dotted lines in the fraction N/lowQ plot correspond to the
fraction of bases with quality score 4 or less. ∇ "Predicted variants" (dashed line) is the expected error frequency expressed as a Phred score,
and may be compared with the "Variants by cycle" graph (solid line). "Mean Q" (solid) is the numerical
mean Q score and is a measure of the average information content per read. These graphs use mapped reads only;
the dashed line in the Mean Q plot uses all (PF) reads. All four graphs are calculated on called bases with
Q Phred score above 4 only. ℘ Mapped coverage by G+C. The coverage was averaged over those genomic regions that were covered at least once.
Regions with coverage in the top 0.1 percentile were excluded; the dotted line shows results for all reads.
The G+C fraction was computed from read bases, excluding Ns and bases with quality below 4. ∅ Genomic coverage by G+C. The G+C fraction was computed from the reference genome, over the approximate fragment
Regions with coverage in the top 0.1 percentile were excluded.
The G+C histogram is shown as a dotted line (arbitrary Y scale). ∞ The insert size distribution is summarized by the median and median absolute deviation.
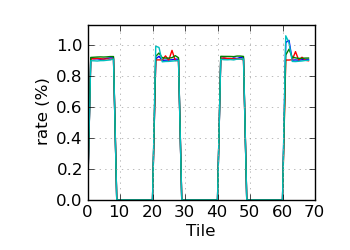
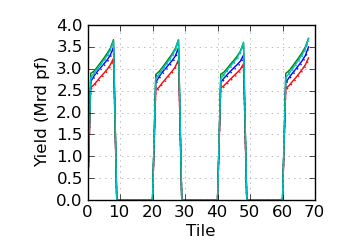
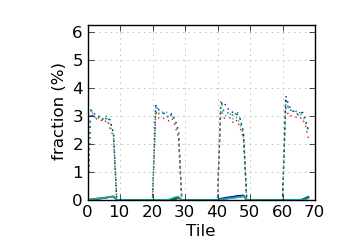
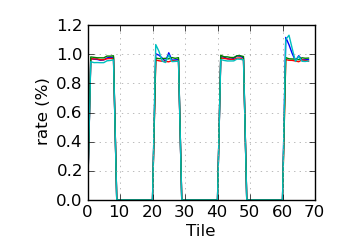
Tile QC statistics and plots
Variant rate by tile∝ (read 1)
 |
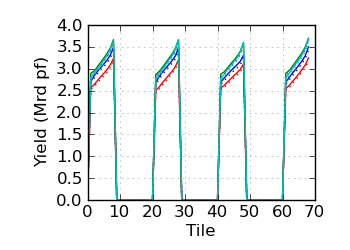
Raw/mapped yield by tile (read 1)
 |
Fraction N/lowQ by tile (read 1)
 |
|
Variant rate by tile∝ (read 2)
 |
Raw/mapped yield by tile (read 2)
 |
Fraction N/lowQ by tile (read 2)
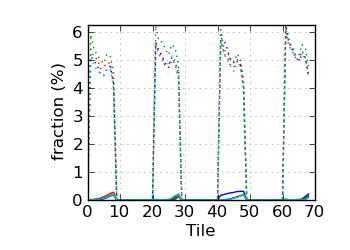 |
∝ HiSeq tiles are grouped in order: swathe 1 top; swathe 1 bottom; swathe 2 top; etc.
QC version: 2.1