Flowcell QC summary (lane 7)
| Date |
Flowcell |
Lane |
Platform Unit |
Readgroup |
Sample |
Library |
Type |
Project |
Genome |
Centre |
| 2011-02-23 |
62WW0AAXX |
7 |
110223_GAII06_00033_FC_7 |
WTCHG_11764_12 |
samples |
111/11_MPX |
DSN Indexed PE |
|
Rat3.4 |
WTCHG |
| Lane |
Length |
Tiles |
Clusters PF |
% PF |
Yield (Mrd) |
Yield (Mb) |
Yield (Mb Q20) |
% Mapped |
% Coverage⊥ |
% Primer |
% Variants |
Mean cov.* |
% high cov.ℵ |
% dups |
% pair dups |
Link |
| 7.1 |
51 |
120 |
367164 |
89.6 |
3.67 |
186.93 |
184.33 |
92.4 |
3.7 |
0.00 |
0.47 ± 0.00 |
1.63 |
9.72 |
4.49 |
0.79 |
lane |
| 7.2 |
51 |
120 |
367164 |
89.6 |
3.67 |
186.93 |
183.76 |
92.3 |
3.7 |
0.00 |
0.49 ± 0.00 |
1.63 |
9.75 |
4.51 |
0.79 |
|
⊥ Fraction of reference that is covered at least once * Mean coverage is computed over regions that are covered at least once ℵ Proportion of reads in regions with coverage in top 0.1 percentile
Lane QC statistics and plots
| Lane |
% GC |
% GCmapped |
σpos(%GC) |
insert ± MAD |
% exonic |
% exon cov'ge |
%N |
maxpos %N |
%lowQ |
%lowQend |
avgQ |
| 7.1 |
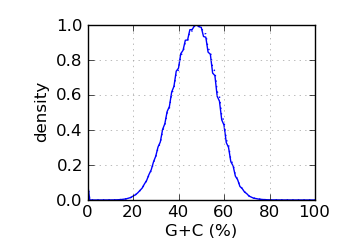
46.6 ± 9.0 |
46.3 ± 8.9 |
3.41 |
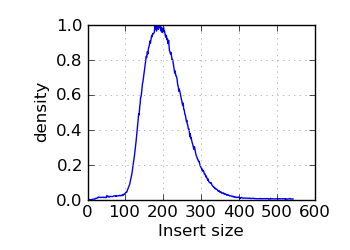
200 ± 40 |
12.3 |
29.3 |
0.0 |
0.6 |
0.7 |
2.6 |
36.6 |
| 7.2 |
46.6 ± 9.0 |
46.4 ± 9.0 |
3.48 |
199 ± 40 |
12.2 |
29.2 |
0.1 |
0.0 |
1.0 |
2.9 |
36.1 |
G+C histogram∋
 |
Insert size histogram∞
 |
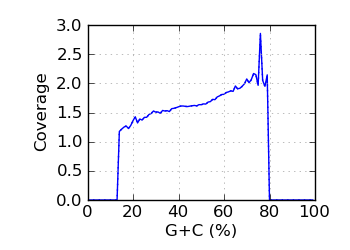
Mapped coverage by G+C℘
 |
|
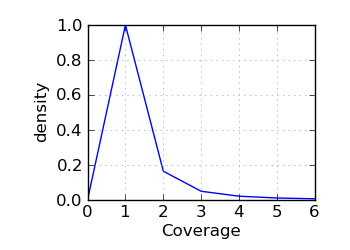
Coverage histogram
 |
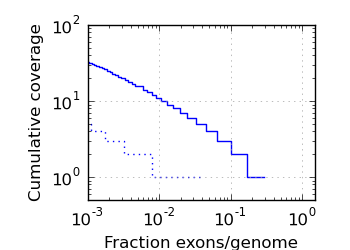
Exon/genome coverage distribution
 |
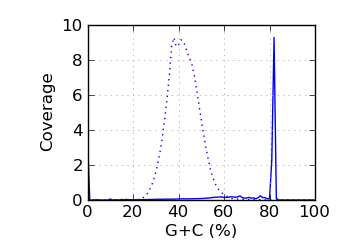
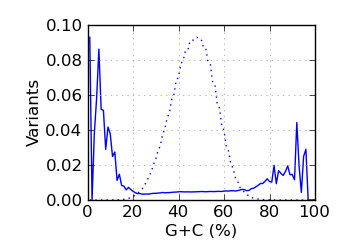
Genomic coverage by G+C∅
 |
|
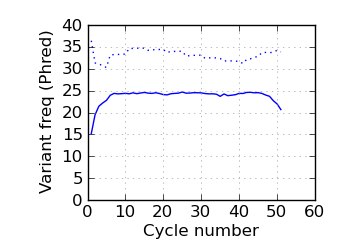
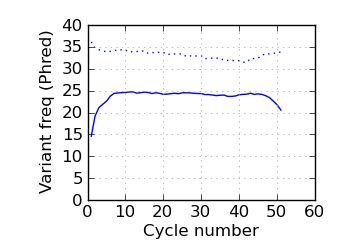
(Predicted) variants by cycle∇ (read 1)
 |
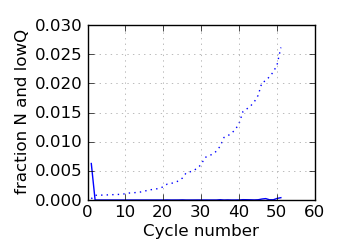
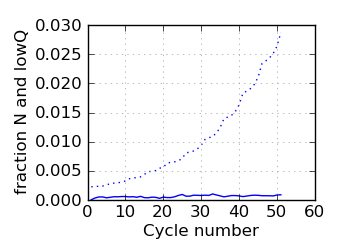
Fraction N/lowQ∋, read 1
 |
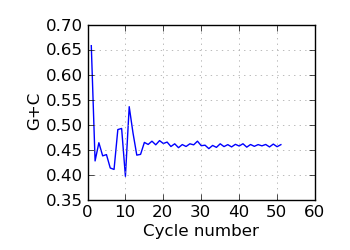
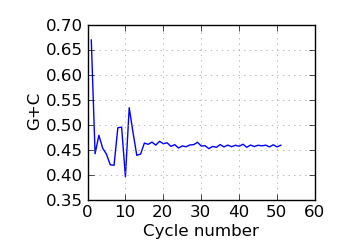
G+C by cycle (PF)∋, read 1
 |
|
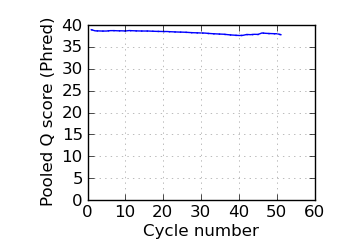
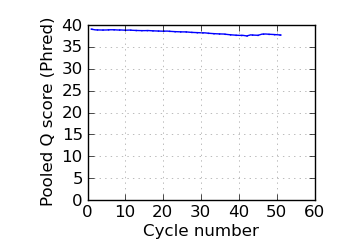
Mean Q by cycle∇, read 1
 |
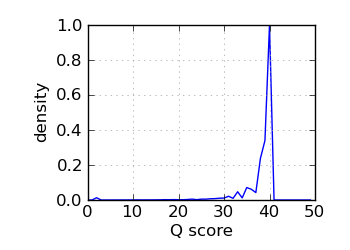
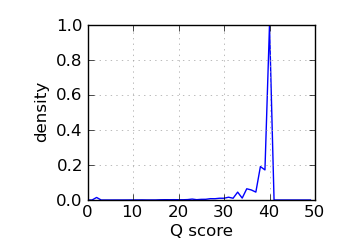
Q score histogram, read 1
 |
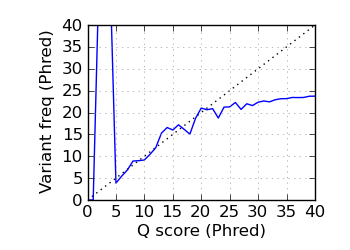
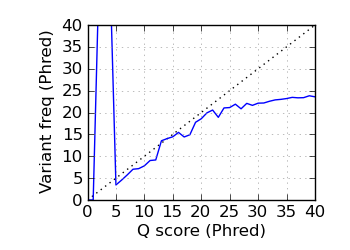
Variants by Q, read 1
 |
|
(Predicted) variants by cycle∇ (read 2)
 |
Fraction N/lowQ∋, read 2
 |
G+C by cycle (PF)∋, read 2
 |
|
Mean Q by cycle∇, read 2
 |
Q score histogram, read 2
 |
Variants by Q, read 2
 |
|
Variants by GC
 |
Log coverage histogram
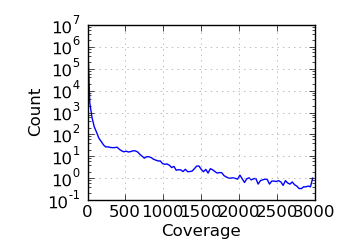 |
Legend
 |
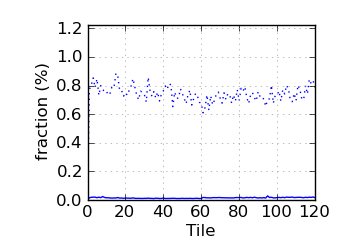
∋ The Fraction N/Low Q plots, and dotted lines on the GC histogram plots, refer to all reads that have
passed chastity filters. If a reference genome was available, all others refer to mapped reads, otherwise
they too refer to chastity-filtered reads. The dotted lines in the fraction N/lowQ plot correspond to the
fraction of bases with quality score 4 or less. ∇ "Predicted variants" (dashed line) is the expected error frequency expressed as a Phred score,
and may be compared with the "Variants by cycle" graph (solid line). "Mean Q" (solid) is the numerical
mean Q score and is a measure of the average information content per read. These graphs use mapped reads only;
the dashed line in the Mean Q plot uses all (PF) reads. All four graphs are calculated on called bases with
Q Phred score above 4 only. ℘ Mapped coverage by G+C. The coverage was averaged over those genomic regions that were covered at least once.
Regions with coverage in the top 0.1 percentile were excluded; the dotted line shows results for all reads.
The G+C fraction was computed from read bases, excluding Ns and bases with quality below 4. ∅ Genomic coverage by G+C. The G+C fraction was computed from the reference genome, over the approximate fragment
Regions with coverage in the top 0.1 percentile were excluded.
The G+C histogram is shown as a dotted line (arbitrary Y scale). ∞ The insert size distribution is summarized by the median and median absolute deviation.
Tile QC statistics and plots
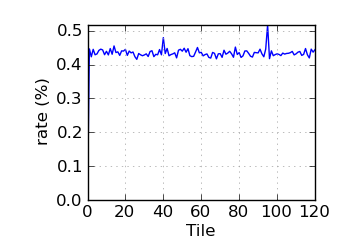
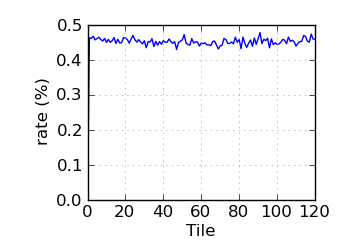
Variant rate by tile∝ (read 1)
 |
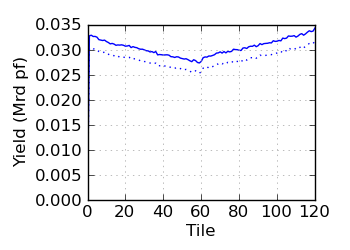
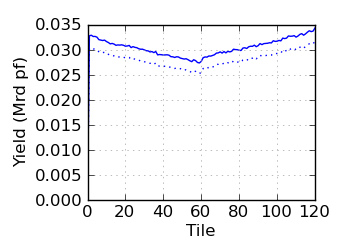
Raw/mapped yield by tile (read 1)
 |
Fraction N/lowQ by tile (read 1)
 |
|
Variant rate by tile∝ (read 2)
 |
Raw/mapped yield by tile (read 2)
 |
Fraction N/lowQ by tile (read 2)
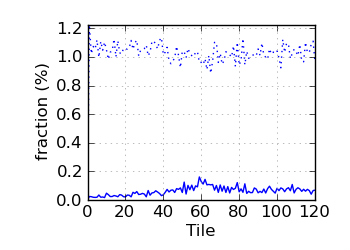 |
∝ HiSeq tiles are grouped in order: swathe 1 top; swathe 1 bottom; swathe 2 top; etc.
QC version: 2.1