 Close
Close
William Valdar(1), Leah C. Solberg(2), Dominique Gauguier(1), Stephanie Burnett(1), Paul Klenerman(3), William O. Cookson(1), Martin Taylor(1), J. Nicholas P. Rawlins(4), Richard Mott(1), Jonathan Flint(1).
1 Wellcome Trust Centre for Human Genetics, University of Oxford, Oxford Roosevelt Drive Oxford OX3 7BN UK.
2 Medical College of Wisconsin, HMGC, 8701 Watertown Plank Road, Milwaukee, WI 53226, USA
3 Peter Medawar Building for Pathogen Research, Nuffield Department of Medicine, University of Oxford, Oxford OX1 3SY, UK.
4 Department of Experimental Psychology, University of Oxford, Oxford, UK.
Difficulties in fine-mapping quantitative trait loci (QTLs) are a major impediment to progress in the molecular dissection of complex traits in mice. Here we show that genome-wide high resolution mapping of multiple phenotypes can be achieved using a stock of genetically heterogeneous mice. We developed a conservative and robust bootstrap analysis to map 843 QTLs with an average 95% confidence interval of 2.8 megabases. The QTLs contribute to variation in 97 traits, including models of human disease (asthma, type 2 diabetes mellitus, obesity and anxiety) as well as immunological, biochemical and haemotological phenotypes. The genetic architecture of almost all phenotypes was complex, with many loci each contributing a small proportion to the total variance. Our data set, freely available at http://gscan.well.ox.ac.uk/, provides an entry point to the functional characterization of genes involved in many complex traits.
The project is funded by a Programme Grant from The Wellcome Trust, with investigators Jonathan Flint, Richard Mott, Nick Rawlins, Dominique Gauguier, Bill Cookson, and by the EU FP6 NOE BIOSAPIENS (PI Richard Mott). Key personnel on the project are William Valdar and Leah Solberg.
#
View and interact with the data at gscan.well.ox.ac.uk/gs/wwwqtl.cgi Download the raw data from the links below.
The aims of the project were to:
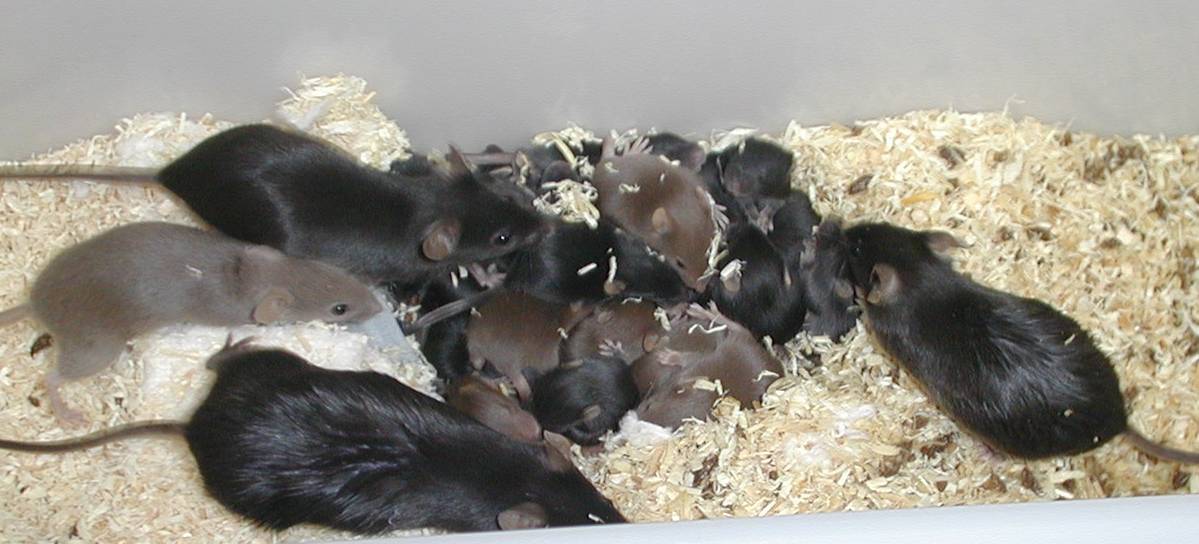
Whole-genome genetic association studies in outbred mouse populations represent a novel approach to identifying the molecular basis of naturally occurring genetic variants, the major source of quantitative variation between inbred strains of mice. Measuring multiple phenotypes in parallel on each mouse would make the approach cost effective, but protocols for phenotyping on a large enough scale have not been developed. In this article we describe the development and deployment of a protocol to collect measures on three models of human disease (anxiety, type II diabetes, and asthma) as well as measures of mouse blood biochemistry, immunology, and hematology. We report that the protocol delivers highly significant differences among the eight inbred strains (A/J, AKR/J, BALBc/J, CBA/J, C3H/HeJ, C57BL/6J, DBA/2J, and LP/J), the progenitors of a genetically heterogeneous stock (HS) of mice.We report the successful collection of multiple phenotypes from 2000 outbred HS animals. The phenotypes measured in the protocol form the basis of a large-scale investigation into the genetic basis of complex traits in mice designed to examine interactions between genes and between genes and environment, as well as the main effects of genetic variants on phenotypes.
Future work includes identifying :
Most mice were microchipped and are named by their barcode, eg
QTLs are mapped to marker intervals, not points. Each marker interval is about 200kb wide on average and is named by the id of the left-hand or proximal marker. The name of the right-hand marker can be determined easily from the genetic or physical map.
The Phenotypes are given as tab-delimited text files with a header, eg.
| SUBJECT.NAME | EMO | GENDER | Family | Date.StudyDay | Date.Month | Date.Year |
| A048005080 | 0.2607 | F | H2.3:G2.2(3) H2.3:C5.2(3) | 113 | 5 | 2003 |
| A048005112 | -0.28775 | F | H2.2:G3.1(3) H2.2:C3.1(4) | 99 | 4 | 2003 |
| A048006063 | -0.38815 | M | E5.2:D4.1(4) E5.2:H5.1(4) | 71 | 3 | 2003 |
| A048006555 | 0.06405 | M | E1.3:D1.2(3) E1.3:H1.2(3) | 92 | 4 | 2003 |
Each phenotype file always contains a column SUBJECT.NAME, followed by other columns containing phenotype measures (e.g. EMO in this example) and folowed by covariates such as GENDER, Family (defined as sibship, and labelled by the names of the parents), Date.StudyDay etc.
Related phenotypes (e.g. all measures pertaining to a particular test) are in the same file. Within each phenotype file only those covariates with a statistically significant association with the phenotypes are included.
Missing data are labelled
The phenotypes measured include:
The Genotypes are given as chromosome-specific text files. Each chromosome is described as a pair of files suitable for input into the R HAPPY package: a ped-format
The Genetic map for each chromosome is also available with file extension ".map" the complete map is available as build34.genetic.map and the build34 sequence map as build34.physical.map
Marker Selection: 15,360 single nucleotide polymorphisms (SNPs) were selected for genotyping based on their predicted diversity between the HS founders' haplotypes. We obtained genotypes for 13,459 SNPs on 1,904 fully phenotyped mice and 298 parents, with an average of 13,441 genotypes per animal and an accuracy of over 99.9%15. 12,534 SNPs were polymorphic in the founder strains and 11,558 were heterozygous in the HS population, indicating that since the inception of the HS 7.8% of markers have drifted to fixation. The mean minor allele frequency was 30.5% in the founders and 26.7% in the HS. The mean interval between markers was 204.4 Kb, (s.d. 231.2 Kb) and 92.5% of the genome is within 500 Kb of a SNP. However, five intervals are larger than 3 Mb of which the largest (11.3Mb) is on the X chromosome
The results of genome scans for 101 phenotypes are available from gscandb. The models used to fit each phenotype are given in the Model Menu, using the R language model syntax. Most phenotypes were fit using a linear modelexcept for three latency phenotypes that were fitted using a survival modelling framework.
Contact Richard Mott Jonathan Flint or William Valdar for more details.