Flowcell QC summary (lanes 1,2,3,4,5,6,7)
| Date |
Flowcell |
Lane |
Platform Unit |
Readgroup |
Sample |
Library |
Type |
Project |
Genome |
Centre |
|
B04CRABXX |
1 |
110307_SN685_0058_BB04CRABXX_1 |
WTCHG_12341 |
samples |
4629/10 |
gDNA PE |
P100244 |
Mouse37 |
WTCHG |
|
B04CRABXX |
2 |
110307_SN685_0058_BB04CRABXX_2 |
WTCHG_12342 |
samples |
4630/10 |
gDNA PE |
P100244 |
Mouse37 |
WTCHG |
|
B04CRABXX |
3 |
110307_SN685_0058_BB04CRABXX_3 |
WTCHG_12343 |
samples |
4633/10 |
gDNA PE |
P100244 |
Mouse37 |
WTCHG |
|
B04CRABXX |
4 |
110307_SN685_0058_BB04CRABXX_4 |
WTCHG_12344 |
samples |
4634/10 |
gDNA PE |
P100244 |
Mouse37 |
WTCHG |
|
B04CRABXX |
5 |
110307_SN685_0058_BB04CRABXX_5 |
WTCHG_12345 |
samples |
4635/10 |
gDNA PE |
P100244 |
Mouse37 |
WTCHG |
|
B04CRABXX |
6 |
110307_SN685_0058_BB04CRABXX_6 |
WTCHG_12346 |
samples |
038/11 |
gDNA PE |
P100244 |
Mouse37 |
WTCHG |
|
B04CRABXX |
7 |
110307_SN685_0058_BB04CRABXX_7 |
WTCHG_12347 |
samples |
039/11 |
gDNA PE |
P100244 |
Mouse37 |
WTCHG |
| Lane |
Length |
Tiles |
Clusters PF |
% PF |
Yield (Mrd) |
Yield (Mb) |
Yield (Mb Q20) |
% Mapped |
% Coverage⊥ |
% Primer |
% Variants |
Mean cov.* |
% high cov.ℵ |
% dups |
% pair dups |
Link |
| 1.1 |
101 |
32 |
3244874 |
86.2 |
89.51 |
9040.48 |
8418.09 |
98.3 |
85.7 |
0.00 |
0.94 ± 0.17 |
3.80 |
12.50 |
9.85 |
8.87 |
lane |
| 1.2 |
101 |
32 |
3244874 |
86.2 |
89.51 |
9040.48 |
8345.12 |
98.1 |
85.7 |
0.00 |
0.95 ± 0.17 |
3.79 |
12.48 |
9.83 |
8.88 |
|
| 2.1 |
101 |
32 |
3117225 |
86.9 |
86.73 |
8760.00 |
8185.41 |
98.2 |
84.1 |
0.00 |
0.98 ± 0.00 |
3.75 |
14.60 |
10.54 |
9.62 |
lane |
| 2.2 |
101 |
32 |
3117225 |
86.9 |
86.73 |
8760.00 |
8099.50 |
98.0 |
84.1 |
0.00 |
0.99 ± 0.00 |
3.74 |
14.59 |
10.53 |
9.64 |
|
| 3.1 |
101 |
32 |
3113709 |
87.0 |
86.72 |
8758.45 |
8196.95 |
98.3 |
84.6 |
0.00 |
0.96 ± 0.17 |
3.74 |
13.92 |
10.31 |
9.43 |
lane |
| 3.2 |
101 |
32 |
3113709 |
87.0 |
86.72 |
8758.45 |
8102.81 |
98.1 |
84.6 |
0.00 |
0.97 ± 0.17 |
3.73 |
13.91 |
10.30 |
9.45 |
|
| 4.1 |
101 |
32 |
2790939 |
88.3 |
78.87 |
7966.28 |
7509.88 |
98.0 |
83.1 |
0.00 |
0.86 ± 0.00 |
3.45 |
11.81 |
8.41 |
7.54 |
lane |
| 4.2 |
101 |
32 |
2790939 |
88.3 |
78.87 |
7966.28 |
7425.53 |
97.8 |
83.1 |
0.00 |
0.89 ± 0.00 |
3.44 |
11.80 |
8.39 |
7.55 |
|
| 5.1 |
101 |
32 |
2846642 |
88.3 |
80.43 |
8123.01 |
7649.51 |
98.2 |
83.3 |
0.00 |
0.91 ± 0.00 |
3.51 |
13.61 |
8.76 |
7.86 |
lane |
| 5.2 |
101 |
32 |
2846642 |
88.3 |
80.43 |
8123.01 |
7560.74 |
98.0 |
83.3 |
0.00 |
0.94 ± 0.00 |
3.50 |
13.60 |
8.75 |
7.87 |
|
| 6.1 |
101 |
32 |
3478166 |
85.8 |
95.54 |
9649.34 |
8998.68 |
98.4 |
86.1 |
0.00 |
0.98 ± 0.00 |
4.04 |
14.69 |
11.09 |
10.12 |
lane |
| 6.2 |
101 |
32 |
3478166 |
85.8 |
95.54 |
9649.34 |
8872.29 |
98.2 |
86.1 |
0.00 |
0.99 ± 0.00 |
4.04 |
14.69 |
11.08 |
10.14 |
|
| 7.1 |
101 |
32 |
3234845 |
86.4 |
89.48 |
9037.22 |
8378.19 |
98.4 |
84.9 |
0.00 |
1.01 ± 0.33 |
3.84 |
13.29 |
8.66 |
7.72 |
lane |
| 7.2 |
101 |
32 |
3234845 |
86.4 |
89.48 |
9037.22 |
8315.37 |
98.2 |
84.8 |
0.00 |
0.94 ± 0.00 |
3.84 |
13.29 |
8.65 |
7.74 |
|
⊥ Fraction of reference that is covered at least once * Mean coverage is computed over regions that are covered at least once ℵ Proportion of reads in regions with coverage in top 0.1 percentile
Lane QC statistics and plots
| Lane |
% GC |
% GCmapped |
σpos(%GC) |
insert ± MAD |
% exonic |
% exon cov'ge |
%N |
maxpos %N |
%lowQ |
%lowQend |
avgQ |
| 1.1 |
40.7 ± 8.0 |
40.7 ± 7.9 |
0.36 |
371 ± 45 |
1.0 |
88.0 |
0.0 |
0.0 |
5.1 |
25.8 |
31.1 |
| 1.2 |
39.5 ± 9.6 |
39.6 ± 9.4 |
0.39 |
371 ± 45 |
1.0 |
87.9 |
0.1 |
0.1 |
6.0 |
24.6 |
30.0 |
| 2.1 |
41.1 ± 8.1 |
41.0 ± 8.2 |
0.38 |
376 ± 63 |
1.2 |
90.7 |
0.0 |
0.0 |
4.9 |
25.2 |
31.2 |
| 2.2 |
40.1 ± 9.8 |
40.2 ± 9.5 |
0.35 |
375 ± 63 |
1.2 |
91.0 |
0.0 |
0.1 |
5.9 |
24.7 |
30.0 |
| 3.1 |
41.0 ± 8.0 |
40.9 ± 8.0 |
0.35 |
377 ± 38 |
1.2 |
90.8 |
0.0 |
0.0 |
4.8 |
24.6 |
31.3 |
| 3.2 |
39.9 ± 9.7 |
40.0 ± 9.4 |
0.35 |
377 ± 38 |
1.2 |
90.8 |
0.0 |
0.1 |
5.9 |
24.5 |
30.0 |
| 4.1 |
41.0 ± 7.9 |
40.9 ± 7.9 |
0.48 |
365 ± 36 |
1.1 |
85.6 |
0.0 |
0.0 |
4.4 |
21.6 |
31.5 |
| 4.2 |
39.9 ± 9.4 |
40.5 ± 8.0 |
0.59 |
366 ± 36 |
1.0 |
85.4 |
0.0 |
0.2 |
5.3 |
22.6 |
30.3 |
| 5.1 |
41.0 ± 7.9 |
41.0 ± 8.0 |
0.38 |
377 ± 44 |
1.1 |
88.4 |
0.0 |
0.0 |
4.4 |
21.9 |
31.4 |
| 5.2 |
40.0 ± 9.6 |
40.1 ± 9.3 |
0.34 |
377 ± 45 |
1.1 |
88.4 |
0.1 |
0.2 |
5.5 |
22.8 |
30.2 |
| 6.1 |
41.3 ± 8.1 |
41.3 ± 8.0 |
0.37 |
411 ± 43 |
1.2 |
93.7 |
0.0 |
0.0 |
5.0 |
25.4 |
31.1 |
| 6.2 |
40.3 ± 10.0 |
40.4 ± 9.7 |
0.46 |
411 ± 43 |
1.2 |
94.0 |
0.0 |
0.1 |
6.4 |
25.7 |
29.8 |
| 7.1 |
41.8 ± 8.1 |
41.7 ± 8.1 |
0.38 |
398 ± 30 |
1.3 |
94.4 |
0.0 |
0.0 |
5.4 |
28.5 |
30.9 |
| 7.2 |
40.9 ± 9.8 |
40.9 ± 9.5 |
0.46 |
398 ± 30 |
1.4 |
94.6 |
0.0 |
0.1 |
6.3 |
27.4 |
29.9 |
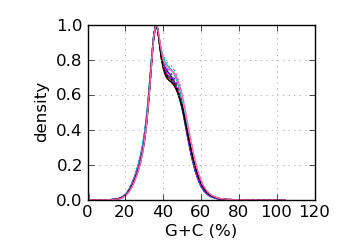
G+C histogram∋
 |
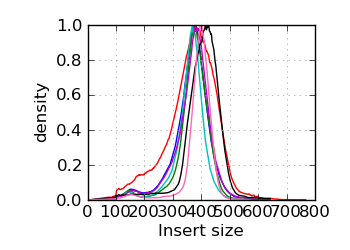
Insert size histogram∞
 |
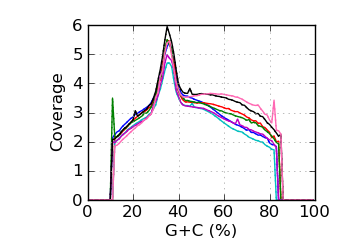
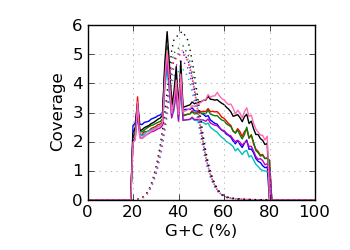
Mapped coverage by G+C℘
 |
|
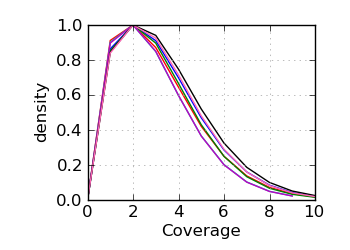
Coverage histogram
 |
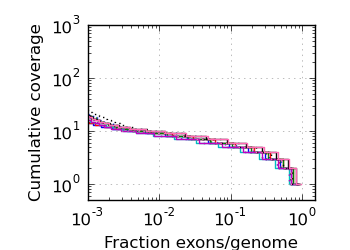
Exon/genome coverage distribution
 |
Genomic coverage by G+C∅
 |
|
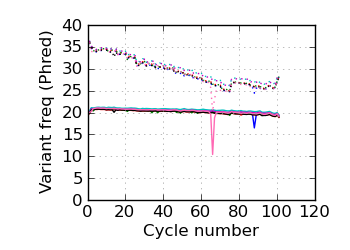
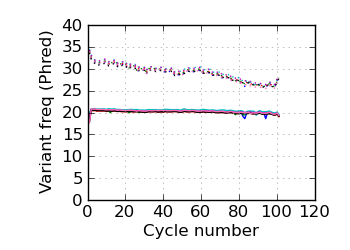
(Predicted) variants by cycle∇ (read 1)
 |
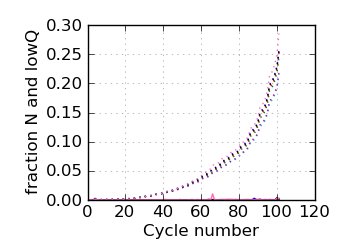
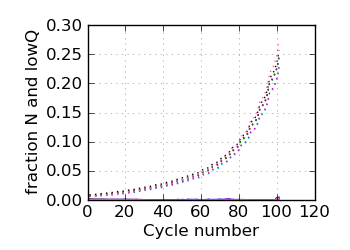
Fraction N/lowQ∋, read 1
 |
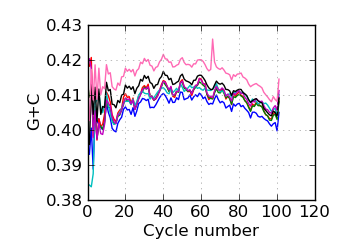
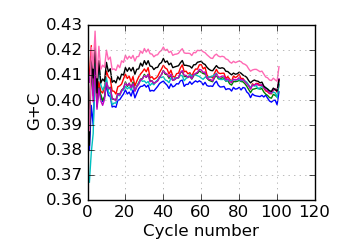
G+C by cycle (PF)∋, read 1
 |
|
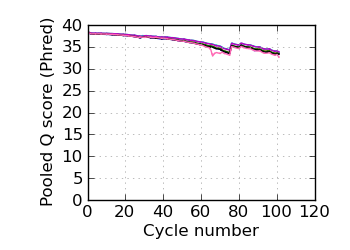
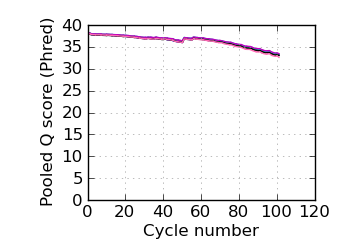
Mean Q by cycle∇, read 1
 |
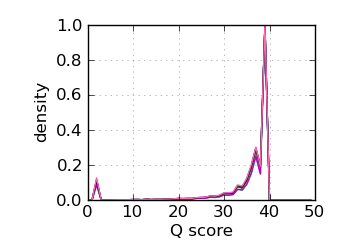
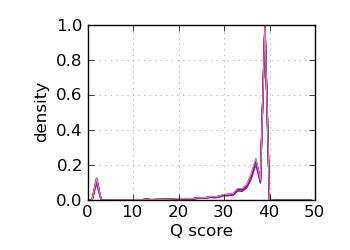
Q score histogram, read 1
 |
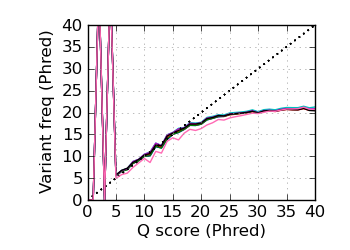
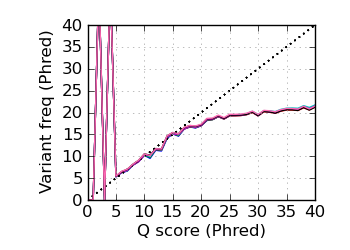
Variants by Q, read 1
 |
|
(Predicted) variants by cycle∇ (read 2)
 |
Fraction N/lowQ∋, read 2
 |
G+C by cycle (PF)∋, read 2
 |
|
Mean Q by cycle∇, read 2
 |
Q score histogram, read 2
 |
Variants by Q, read 2
 |
|
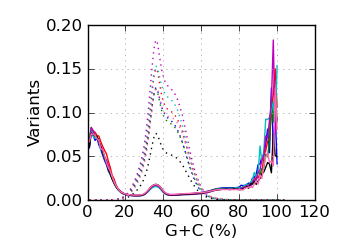
Variants by GC
 |
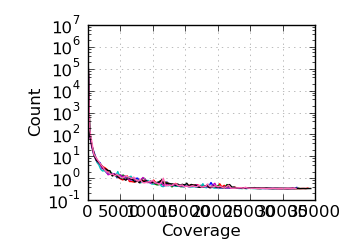
Log coverage histogram
 |
Legend
 |
∋ The Fraction N/Low Q plots, and dotted lines on the GC histogram plots, refer to all reads that have
passed chastity filters. If a reference genome was available, all others refer to mapped reads, otherwise
they too refer to chastity-filtered reads. The dotted lines in the fraction N/lowQ plot correspond to the
fraction of bases with quality score 4 or less. ∇ "Predicted variants" (dashed line) is the expected error frequency expressed as a Phred score,
and may be compared with the "Variants by cycle" graph (solid line). "Mean Q" (solid) is the numerical
mean Q score and is a measure of the average information content per read. These graphs use mapped reads only;
the dashed line in the Mean Q plot uses all (PF) reads. All four graphs are calculated on called bases with
Q Phred score above 4 only. ℘ Mapped coverage by G+C. The coverage was averaged over those genomic regions that were covered at least once.
Regions with coverage in the top 0.1 percentile were excluded; the dotted line shows results for all reads.
The G+C fraction was computed from read bases, excluding Ns and bases with quality below 4. ∅ Genomic coverage by G+C. The G+C fraction was computed from the reference genome, over the approximate fragment
Regions with coverage in the top 0.1 percentile were excluded.
The G+C histogram is shown as a dotted line (arbitrary Y scale). ∞ The insert size distribution is summarized by the median and median absolute deviation.
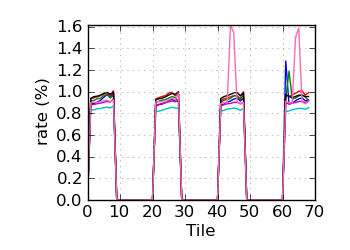
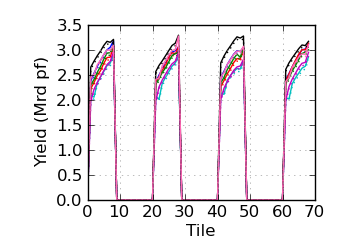
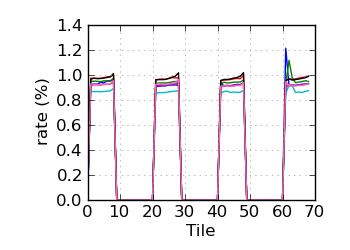
Tile QC statistics and plots
Variant rate by tile∝ (read 1)
 |
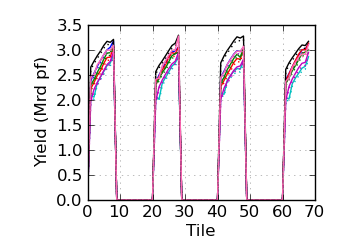
Raw/mapped yield by tile (read 1)
 |
Fraction N/lowQ by tile (read 1)
 |
|
Variant rate by tile∝ (read 2)
 |
Raw/mapped yield by tile (read 2)
 |
Fraction N/lowQ by tile (read 2)
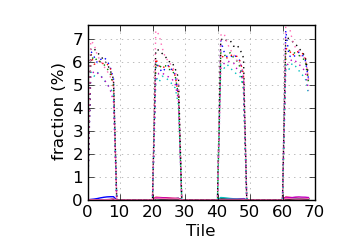 |
∝ HiSeq tiles are grouped in order: swathe 1 top; swathe 1 bottom; swathe 2 top; etc.
QC version: 2.1